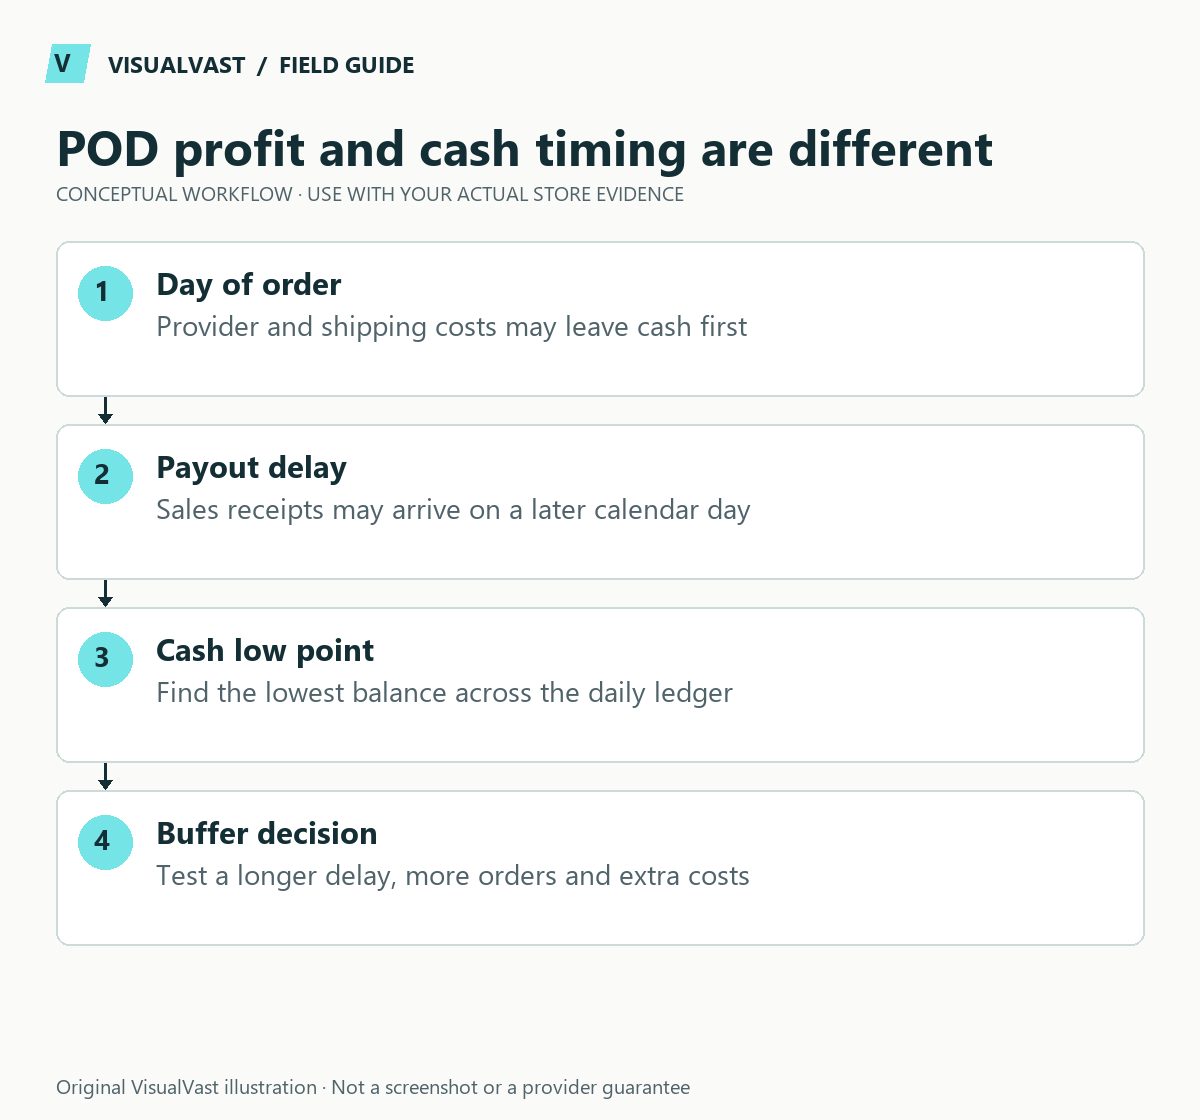
A profitable POD order can still create a cash shortfall if production is charged before the customer payment becomes available to you. Estimate the timing gap separately from profit margin. Use actual provider charges and payment-provider payout terms; do not assume the customer’s payment immediately funds fulfillment.
Printify explains that, for connected sales channels, it charges production and shipping separately from the money collected by the channel. Its Pop-Up Store follows a different model. This guide focuses on a connected owned store such as WooCommerce.
Start with a simple bridge estimate
For a stable illustrative scenario, multiply expected orders per day by the average cash cost charged per order, then by the days before usable payouts arrive. Add a separately stated reserve for refunds, replacements and variability. This is a rough planning model, not a credit recommendation or a forecast.
Suppose a fictional store expects 10 orders each day, pays $18 per order for the selected production and shipping assumptions, and has a five-day gap before the related payouts are usable. The simplified bridge is 10 × $18 × 5 = $900. Adding an illustrative $200 reserve gives $1,100. These values are invented for explanation; replace every one with your own evidence.
Do not treat that result as a safe maximum. Order spikes, taxes charged by the provider, payout holds, refunds, exchange costs or different billing dates can increase the requirement. Contribution margin and owner pay are separate questions.
Build a daily ledger for a realistic view
Use this guide’s worksheet in the fillable workbook (PDF, page 31). Download and save a copy to retain your entries.
Use the pod cash-flow calculator · Use the owned-store break-even calculator
| Day | Opening available cash | Usable payouts | Provider and other cash outflows | Closing cash |
|---|---|---|---|---|
| 1 | Enter your balance | Enter cleared funds only | Enter expected charges | Opening plus inflows minus outflows |
| 2 | Previous closing cash | Enter scheduled usable funds | Include new orders and exceptions | Repeat calculation |
| 3 onward | Continue daily | Reflect weekends/holds where applicable | Reflect actual billing timing | Find the lowest balance |
The lowest projected balance shows the pressure point under that scenario. Compare a normal week, a promotion week and a delayed-payout week. If the model goes negative, change the operating plan before taking orders you cannot fund. Do not assume credit will be available or affordable.
Keep the inputs auditable
Record where each input came from and when it was checked: provider quote, shipping destination, recent order mix, payout schedule or actual invoice. Separate dollars collected from customers from dollars available to spend. Keep customer refunds and provider credits on their own dates rather than netting them away prematurely.
The browser-local cash-flow calculator exposes its assumptions, validates inputs and shows a daily ledger alongside the headline result. It does not connect to bank accounts, recommend borrowing or imply tax completeness. Use the linked calculator and CSV export, or reproduce the calculation manually with the ledger above.
Connect funding to launch readiness
Use the POD launch checklist to verify approval and billing responsibilities, and the provider evaluation worksheet to compare equivalent products. Mixed-cart shipping subsidies belong in the shipping test plan.
Bring the assumptions to Multichannel & POD implementation or an Owned Store Readiness Audit. The goal is to reveal an operating constraint before launch, not to promise that a given cash balance will make the business successful.